Introduction to the Algorithm
Sepsis is a life-threatening organ dysfunction triggered by dysregulated host immune response to infection. As per CDC, at least 1.7 million adults in United States develop sepsis each year with approximately 270,000 deaths. one in three death in hospital is a patient of sepsis.
Acute changes in Sequential Organ Failure Assessment (SOFA) score helps clinically characterize organ dysfunction as a consequent to the infection. This is characterized as SOFA score change of >=2 in 24 hours. It reflects mortality risk of approximately 10% in hospital population having suspected infection. Suspected or documented infections are other measures help identify sepsis.
SOFA score is calculated based on the degree of dysfunction of six organ system. The following parameters are used in each organ system to calculate individual score that cumulatively reflects SOFA score.
- Respiratory System: PaO2/FiO2 ratio
- Coagulation System: Platelet count
- Hepatobiliary System (Liver): Bilirubin level
- Cardiovascular System: Mean Arterial Pressure (MAP), or requirement of vasopressin administration
- Renal System: Creatinine level, or urine output
- Central Nervous System: Glasgow Coma Scale score
Application Roadmap
Sepsis is defined as life-threatening organ dysfunction due to infection. Prior to COVID, there were more than 270,000 sepsis deaths annually (ref: CDC). COVID has added substantially to that burden: there have been more than 900 COVID deaths at Emory alone. Timely recognition of progressive organ dysfunction is essential to clinical decision-making that saves lives. Unfortunately, given the overwhelming number of patients and flows of data, the earliest signs of deterioration are easily overlooked.
A real-time dashboard to calculate a patient’s risk of developing sepsis in the near future using the sepsis-3 definition of:
- A 2-point degradation in Sequential Organ Failure Assessment (SOFA) score
- Recent orders of blood cultures, and
- Recent orders of new antibiotics
Design and Implementation
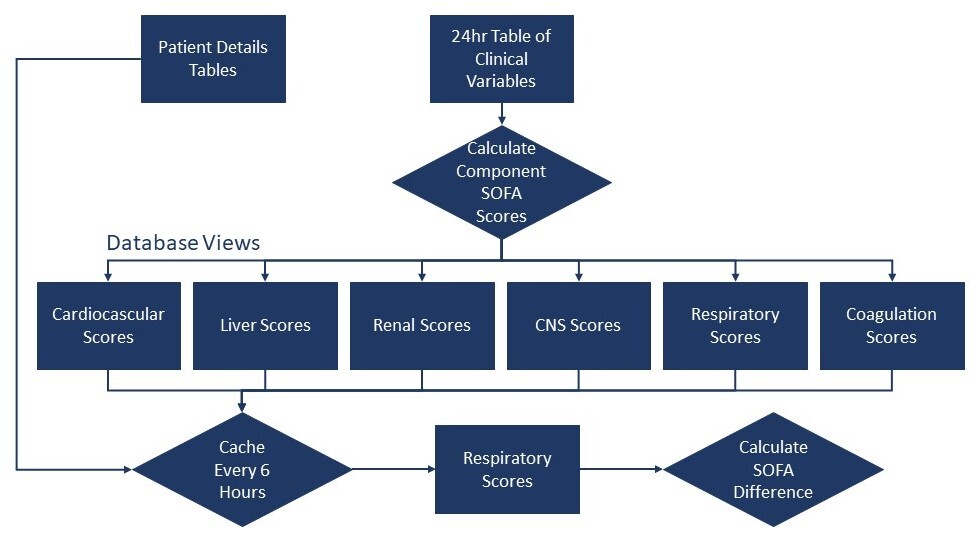
The following diagram shows the flow of information from Cerner clinical events tables and patient information tables to six database views that compute scores used in the dashboard display.

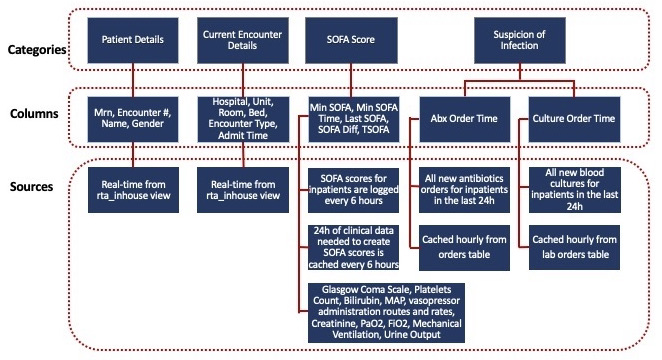
The 6 database views are then combined with person Ids into a single view. The data from the consolidated view is then cached into a table every 6 hours along with a timestamp. The cached table is referenced to calculate the most recent total SOFA, the minimum total SOFA in the last 24h, and the difference between these. Those patients with a difference of >=2 are displayed in the dashboard. In addition, the dashboard pulls in blood cultures and antibiotics orders which are obtained from the Cerner database using order times. The most recent order time is assigned as suspicion. This information is then merged with inpatient information and their current locations.


